

Playing With the Squares - 2 x 2 Matrix Variations
Playing With the Squares - 2 x 2 Matrix Variations
Adaptable and useful tool for categorising

The previous post - Not Everything Is Urgent and Important - was one of the most read so far, and quite a few people got back to me with positive feedback. It’s focused on Eisenhower Matrix (a.k.a. Stephen Covey Matrix), which is dividing tasks by urgency and importance on a 2 x 2 matrix.

This is why, today, I wanted to share some other ways to use 2 x 2 matrices.
2 x 2 for a Flexible Visualization

2 x 2 matrix is a very adaptable and useful tool for categorizing anything that could be reduced to two variables. It is especially useful when quantitative information is unavailable, but we need to group different items.
At a point, the 2 x 2 matrix even got a bit of a bad name as it’s grown so popular that it got overused by consultants, with a matrix ready for anything and everything. Still, I do find it useful both in my private and professional life.
The matrix consists of two axes for each of the variables (qualities), with 4 squares formed between them. Each square would be a combination of the 2 qualities (whether high and high, low and low etc.). Usually, the ‘high and high’ square would be the most desirable, and it would be placed in the upper right or upper left.
Different Values (Variables)
Recently, I was struggling between different free-time activities: learning Hebrew, learning JavaScript, or taking a drawing class. This could be visualized by the ease of doing and joyfulness:

As ease is currently an important factor to me (I needed to just relax), I went with the drawing.
You could do this for almost anything:
Food options (e.g. effort x healthy; tasty x healthy; cheap x …);
Books you’d like to read (e.g. interesting x informative; interesting x recent; famous x …)
Activities
Bigger decisions
You would most likely be able to visualize whatever is meaningful to you, as long as you can pick 2 main variables. Additionally, you could see where the same items would fall on two or more different matrices.
However, I think this exercise is most useful for a larger number of items, as well as after decision-making.
Emerging Patterns
I find this matrix mostly useful for grouping a larger number of items, as patterns emerge.
Instead of using the 2 x 2 matrix ‘only’ to prioritize and make decisions on what to do, I like to group tasks that I’ve finished. I organize them based on how much I liked them, and how hard it was. It’s a nice visualization of your (work) days or weeks. As it felt more natural, I used antonyms rather than scale, which you can also do, but be mindful of how you organize the squares.
Within a month’s time, I gained interesting insights.
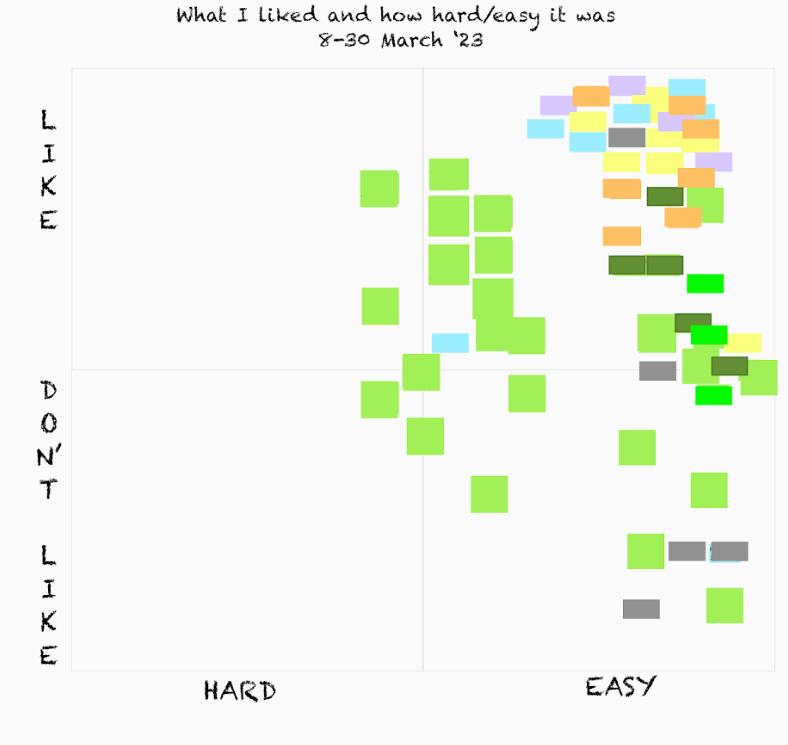
For a (recovering) workaholic, it’s interesting to see black-on-white that I enjoy other things than work more.
Not a lot of items are in the hard zone, which may mean I could take on some more challenges for growth.
It’s also interesting to see the number of different items and their ratio (e.g. work versus social).
All this (and more) would likely just go under my radar if it weren’t for this system. When we go on autopilot, there’s usually not much space for reflection, and we also tend to forget things done (right away).
What Would You Measure and Compare?
This is maybe not life-changing stuff (at least to me), but it’s a very interesting exercise.
I suggest you try for a month and see some patterns emerge. It’s as easy as moving a stickie note (virtual or physical), but you might uncover something interesting.
Best,
Milos